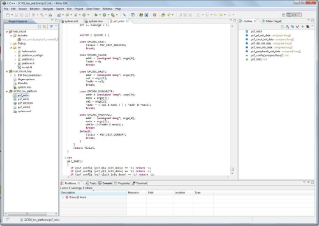
Software Development Kit (SDK)
Note: Starting 2019.2, SDK, SDSoC™ and SDAccel™ development environments are unified into an all-in-one Vitis™ unified software platform for application acceleration and embedded software development. There will be no 2019.2 or future releases of SDK.
The Software Development Kit (SDK) is the Integrated Design Environment for creating embedded applications on any of the award winning microprocessors from AMD: Zynq™ UltraScale+ MPSoC, Zynq 7000 SoCs, and the industry-leading MicroBlaze™ soft-core microprocessor. The SDK is the first application IDE to deliver true homogenous and heterogeneous multi-processor design, debug, and performance analysis. Benefits include:
- Zynq UltraScale+ MPSoC, Zynq 7000 SoCs, and MicroBlaze support
- Included with the Vivado Design Suite or available as a separate free download for embedded software developers
- Based on Eclipse 4.5.0 and CDT 8.8.0 (as of the 2016.3 release)
- Complete Integrated Design Environment (IDE) that directly interfaces to the Vivado embedded hardware design environment
- Complete software design and debug flows supported, including multi-processor and hardware/software co-debug capabilities
- Editor, compilers, build tools, flash memory management, and JTAG debug integration
- Full suite of libraries and device drivers
- FreeRTOS integrated as RTOS available for all platforms
- Software Command Line Tool available for scripting


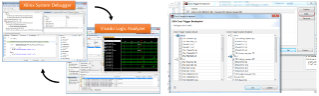
System Debugger
The AMD System Debugger is an integrated debugger supporting Zynq UltraScale+ MPSoC, Zynq 7000 SoC and MicroBlaze cores. It is available from both the command line using the XSCT and from within the SDK GUI in the debug perspective. It supports all the common debug features such as setting breakpoints or watchpoints, stepping through program execution, viewing the program variables and stack, and viewing the contents of the memory in the system. It can also simultaneously debug programs running on different processors (in a multi-processor system), all from within the same debug environment. For example, in a Zynq or Zynq UltraScale+ based design, System Debugger could display both ARM CPUs and multiple MicroBlaze soft-processors in the same debug session, through a single JTAG cable; for an unprecedented level of insight between the hardened processing system, and any additional processing elements that you've added to the programmable logic.

- Based on the Open-Source Target Communication Framework (TCF)
- Homogenous and heterogeneous multi-processor support
- Hierarchical Profiling
- Bare-metal and Linux development, Including Linux OS-Aware debug
- Supporting both SMP and AMP designs
- Associate hardware and software breakpoints per core
- NEON™ library support

In addition to all the features of a full-featured standard software debugger, the System Debugger supports cross-triggering between processors in the PS and processors and hardware in the PL. Through an intuitive GUI, the software programmer can setup conditions for issuing triggers to external processors or hardware on the PL, or receiving triggers from these elements. Data is captured and can be displayed in the various tools to aid in the debugging process.
Custom Design Aware
SDK understands the custom embedded hardware design that has been defined in the Vivado Design Suite. Based on this design, several key parameters are auto-configured, including memory maps, peripheral register settings, tools and library paths, compiler options, JTAG and flash memory settings, debugger connections, and Linux and bare-metal Board Support Packages (BSPs). This custom design-aware pre-configuration, combined with the auto-generation of critical system software, ensures that software development can progress rapidly with a minimal learning curve.

Drivers and Libraries
SDK includes user-customizable drivers for all supported AMD hardware IPs, POSIX compliant kernel library and networking and file handling libraries. These libraries and drivers can scale for the custom-design based on feature needs, memory requirements and hardware capabilities.
Software Profiling
SDK includes profiling tools that help to identify bottle necks in your code occurring due to the interaction of functions that are executed within the programmable logic, and on the processor. Supports hierarchical profiling - allowing the user to view which called functions, or which calling functions are affecting processor performance the most.
System Performance Analysis and Optimization
Creating high-performing SoC based systems takes time and requires insight into the interactions between the software and the peripherals. Tools that allow you to gather performance data and visualize your system are critical to achieving performance targets. The AMD System Performance Analysis toolbox (available in the XSDK) allows you to model, measure, analyze and optimize your system. In the new performance perspective you can visualize.
- Processor utilization
- Instructions per cycle
- Cache miss/hit rates
- Read and Write latency and bandwidth of PL to PS interfaces

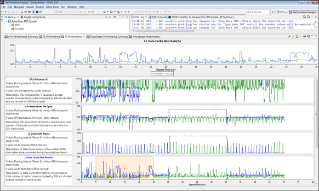

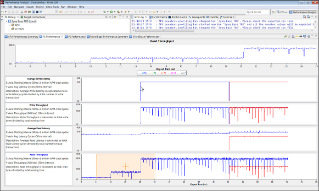

The System Performance Analysis toolbox allows you to interact with your system and tune it to reach your desired performance goals.

With these tools, you can rapidly identify bottlenecks and create “what if” scenarios regarding how to partition your system between hardware and software. Using the AXI Traffic Generators you can model the performance from the IP blocks that will be in the programmable logic before they are completed. Once analyzed, the performance can be improved by optimizing the software source code, by splitting the function between processor and programmable logic, or by migrating the whole function to programmable logic.